B2B Lead Scoring That Works: Copyable Point Ranges & MQL Thresholds
B2B lead scoring ranks prospects by fit and intent so your sales team stops chasing tire kickers and starts calling people who actually buy. The right starting point isn’t a machine learning model, no matter what the vendor demos promise. It’s a rules-based fit-plus-engagement system calibrated against your own closed-won deals from the last 90 to 365 days. Pull those records this week, average the scores, and set your first MQL threshold from that number, not a guess, following a solid digital transformation strategy for business leaders to align your data and systems effectively.
TL;DR:
- A robust lead scoring system should be based on your last 90 to 365 days of closed deals to accurately set the initial MQL threshold.
- Combining fit (company data) and engagement (behavioral signals) into a grid helps prioritize accounts with both high potential and active buying signals.
- For high-volume lead flow and sufficient deal data, predictive or hybrid models outperform rule-based scoring, but most companies should start with transparent rules.
- Regularly calibrate and update your scoring model by tracking conversion rates per score band, ensuring the model reflects current sales realities.
- Implement scoring with visible rationale, fast routing, and clear SLAs to boost rep trust, while maintaining data privacy and avoiding bias in model design.
Table of Contents
- What Is B2B Lead Scoring? Fit vs. Engagement, Score vs. Grade
- Why Lead Scoring Matters for B2B Revenue Teams
- Lead Scoring Models: Rule-Based, Predictive, and Hybrid
- Scoring Signals and Criteria: What to Actually Track
- How to Build a B2B Lead Scoring System, Step by Step
- Calibrating, Measuring, and Iterating on Your Model
- Common Pitfalls and Best Practices in Lead Scoring
- Practical Notes From the Field
- Ethical Considerations and Data Privacy in Lead Scoring
- What Teams Get Wrong About Lead Scoring
- How Rivetline Handles Lead Scoring Implementation
- Sources
- FAQ
What Is B2B Lead Scoring? Fit vs. Engagement, Score vs. Grade
Lead scoring assigns a numeric value to a prospect based on how well they match your ideal customer and how actively they’re engaging with your business. Most systems separate this into two distinct measurements, and confusing the two is the single most common mistake I see in half-built CRM setups.
Fit is usually expressed as a letter grade (A through D), answering “would this account be a good customer if they bought?” It’s built from firmographic and demographic data: company size, industry, job title, tech stack. Fit doesn’t change much week to week.
Engagement (sometimes called the “score”) is a running number that tracks behavior: email opens, pricing page visits, demo requests. It moves constantly, and it answers a completely different question: “are they showing signs of wanting to buy right now?”
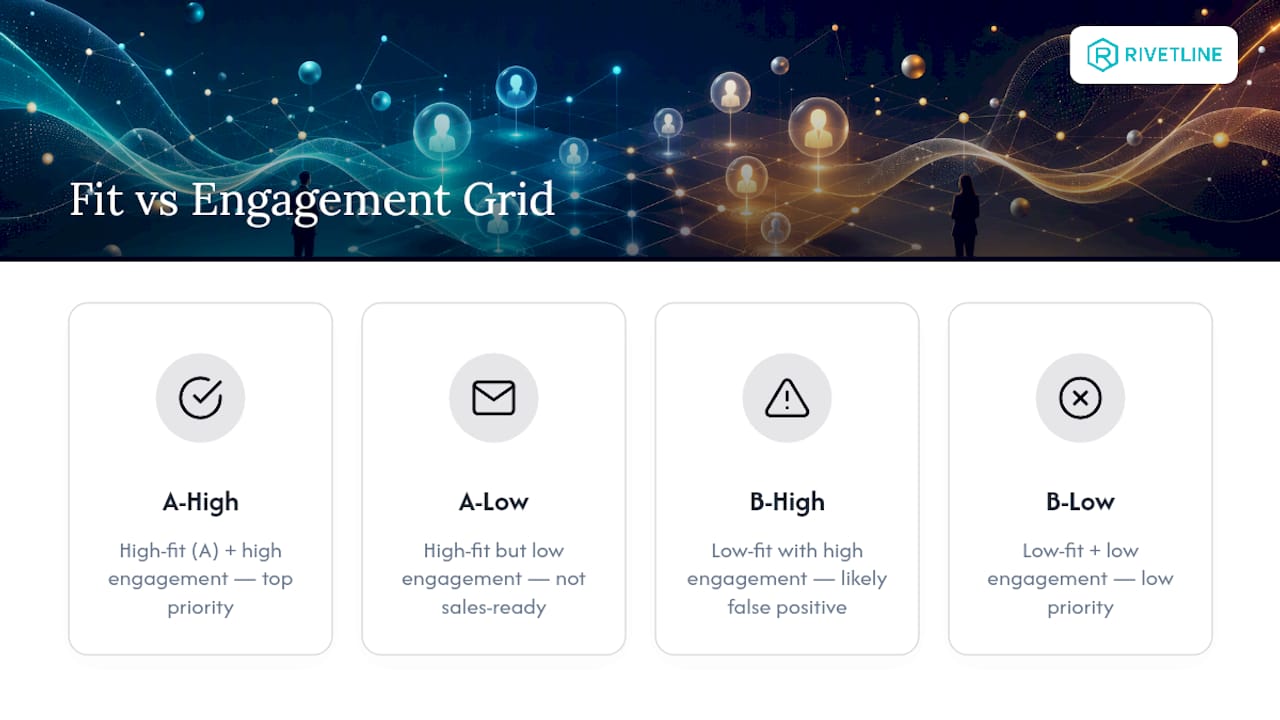
The reason you need both, not just one, comes down to false positives. A high-fit account that never opens an email isn’t sales-ready, no matter how perfectly they match your ICP. A low-fit account that downloads three whitepapers and visits your pricing page five times isn’t worth a rep’s morning either. Combine the two into a grid (A-high, A-low, B-high, and so on) and you get a genuinely actionable priority list instead of a spreadsheet full of noise. This fit-plus-engagement combination is the foundation every model type below builds on, whether it’s a simple point system or a full predictive scoring engine.
Why Lead Scoring Matters for B2B Revenue Teams
Scoring exists to solve one expensive problem: sales reps spending their limited hours on the wrong accounts. Every hour an SDR spends chasing a low-fit lead is an hour not spent on the account that’s three touches away from a demo.
Teams without a working scoring model tend to fail in one of two predictable ways. Either everything gets treated as equally urgent, which burns out reps and trains them to ignore marketing-sourced leads entirely, or nothing gets flagged as urgent, and hot accounts sit in a queue until they’ve gone cold and signed with a competitor. Both failure modes are self-inflicted, and both are fixable within a quarter.
When scoring is calibrated correctly, sales and marketing stop arguing about lead quality because they’re finally looking at the same number. Marketing can show which channels produce leads that actually convert, and sales gets a queue that’s pre-sorted by likelihood to close. Industry playbooks consistently point to a 60 to 90 day window before teams see measurable movement in conversion rates after a scoring model goes live. That’s not instant, but it’s fast enough to justify the setup time.
Lead Scoring Models: Rule-Based, Predictive, and Hybrid
Pick the wrong model for your data volume and you’ll either waste engineering time on a predictive system with nothing to predict from, or leave money on the table running rules when you have enough history to do better.
Rule-based scoring assigns fixed point values to specific attributes and actions. Someone in your target industry gets 15 points; a pricing page visit gets 10. It’s transparent (any rep can see exactly why a lead scored 72), fast to launch, and it’s the right call for most companies just getting started. The tradeoff is that it doesn’t learn or adjust itself. You have to update it manually as your business changes.
Predictive scoring uses machine learning to find patterns across historical deal data that humans would miss. A recent case study comparing 15 different classifiers found that Gradient Boosting outperformed the rest, with LightGBM and XGBoost close behind. The catch: predictive models need hundreds of clean, consistent closed deals in your CRM and someone technical enough to build, validate, and monitor them. If you don’t have that volume of history, skip it for now.
Hybrid scoring layers a predictive model on top of your existing rules once you have the data to support it, using the rules as a floor and the model to fine-tune weighting.
Run this checklist before choosing:
- Do you have at least a few hundred closed deals with consistent CRM data?
- Is your sales team already trusting and using a simpler scoring system?
- Do you have engineering or data science support to build and maintain a model?
- Is your lead volume high enough that manual scoring adjustments can’t keep up?
If you answered “no” to more than one, start with rules.
Scoring Signals and Criteria: What to Actually Track
A scoring model is only as good as the signals feeding it, and most teams either track too little (just job title and company size) or too much (every click, weighted equally, which drowns real intent in noise).
Firmographic and demographic signals establish fit:
- Target industry match: +20 points
- Company size within ICP range: +15 points
- Decision-maker job title (VP, Director, C-suite): +20 points
- Known competitor’s tech stack in place: +10 points
- Cap firmographic total at 50 points so fit alone can’t push someone into “sales-ready” territory
Behavioral engagement signals track intent:
- Pricing page visit: +10 points (cap at 20 points regardless of visit count)
- Demo request: +25 points
- Content download (gated whitepaper, case study): +5 points per download, capped at 15
- Email open with click-through: +3 points
- Three or more site visits in seven days: +10 points
Third-party intent data adds a layer most rule-based models skip entirely, and it’s worth the extra cost if your budget allows it. Combining onsite behavior with offsite research signals, like a prospect researching competitor products across the web, gives a meaningfully more accurate picture of which accounts are actually in a buying window versus just curious. Weight intent data conservatively at first (5 to 10 points max) until you’ve validated it against your own closed-won data.
Statistic to watch: in the Frontiers case study on B2B lead prioritization, “lead source” and “lead status” turned out to be among the highest-importance features for predicting conversion, meaning where a lead came from mattered more than raw page-view counts. That’s worth remembering before you obsess over tracking every click.
Don’t forget negative signals: a personal email domain, a job title like “student,” or a bounce-back on company email should subtract points, not just fail to add any.
How to Build a B2B Lead Scoring System, Step by Step
Building this correctly takes a few weeks, not a quarter, if you follow the sequence in order instead of jumping straight to CRM automation before the data underneath it is sound.
-
Pull your closed-won and closed-lost data. Export the last 90 to 365 days of deals from your CRM and look for patterns. What job titles, company sizes, and behaviors show up disproportionately in the closed-won column versus closed-lost? This is where “source” and “lead status” often surface as unexpectedly strong predictors.
-
Map signals to points and set score bands. Assign values using the ranges above as a starting template, then calculate the average score of your closed-won deals. That average becomes your initial MQL threshold, a method most credible lead scoring guides converge on because it’s grounded in your actual conversion history instead of an arbitrary round number.
-
Implement the rules in your CRM or marketing automation platform and make the “why” visible. Every lead record should show the specific actions and attributes driving the score, not just a final number. Reps ignore black-box scores. They trust ones they can see the logic behind.
-
Automate routing, alerts, and SLAs. Set a rule that any lead crossing your MQL threshold gets routed to a rep within a defined window, commonly under 15 minutes for genuinely hot leads and same-day for warmer ones. Response-time benchmarks matter here: a lead that sits unrouted for six hours has usually cooled off or found a competitor.
-
Roll out with training, not a memo. Walk reps through exactly how scores are built and why. Track adoption for the first month: are reps actually working leads in score order, or reverting to gut instinct? Monitor conversion by score band weekly during rollout, then shift to a lighter cadence once the model proves stable.
Pro Tip: Surface the specific pages visited and actions taken directly on the lead record inside your CRM, not buried in a separate analytics tool. Transparency drives rep adoption far more than a marginally more accurate score they can’t see the logic behind.
Calibrating, Measuring, and Iterating on Your Model
A scoring model you never revisit is worse than no model, because it gives everyone false confidence in numbers that stopped reflecting reality months ago.

Validate score bands by tracking conversion rate and pipeline value for each tier separately. If your “hot” band (say, 80 to 100 points) isn’t converting meaningfully better than your “warm” band (50 to 79), your weighting is off somewhere and needs adjustment before you trust it further.
Run holdout tests when you change thresholds. Move your MQL cutoff for a subset of leads while keeping the rest on the old threshold, then compare conversion rates after a few weeks. This tells you whether the change actually improved targeting or just shifted volume around.
| Score band | Typical label | What to track |
|---|---|---|
| Cold / unqualified | Cold / unqualified | Low conversion, minimal sales follow-up |
| Warm / nurture | Warm / nurture | Marketing nurture, periodic re-scoring |
| MQL / sales-ready | MQL / sales-ready | Conversion rate, response time, routing accuracy |
| 90 to 100 | Hot / priority | Immediate routing, close rate, deal velocity |
Review the full model quarterly at minimum. Watch for signals that trigger an off-cycle re-weighting: a sudden shift in which lead sources convert, a new product line changing your ICP, or a score band’s conversion rate drifting more than a few points in either direction. Playbooks built around this cadence report measurable ROI within 60 to 90 days of a properly calibrated launch, which is a realistic timeline to set expectations against internally.
Common Pitfalls and Best Practices in Lead Scoring
Most broken scoring models fail for the same handful of reasons, and every one of them is preventable.
- Opaque scoring that reps can’t interrogate gets ignored within a month.
- Alert fatigue from routing every mild engagement spike as “urgent” trains reps to mute notifications entirely.
- Stale enrichment data (old job titles, outdated company sizes) quietly corrupts fit scores over time.
- Overfitting predictive models launched too early on thin data, chasing patterns that don’t actually hold up.
Best practice is boring but effective: keep scoring transparent, re-score leads daily or weekly rather than in real time for every micro-action, cap point categories so no single signal can dominate, and match your SLA commitments to what your team can actually staff.
Pro Tip: This week, fix three things: cap your firmographic points so fit alone can’t trigger MQL status, audit your CRM for stale job title data older than six months, and confirm your routing SLA matches your actual rep capacity, not an aspirational number from a sales kickoff deck.
Practical Notes From the Field
Dashboards win rep trust when they show the “why,” not just the number. Connecting Google Business Profile and GA4 data into a live Looker Studio dashboard, then piping that into CRM lead records, lets reps see exactly which pages and actions moved a score before they ever pick up the phone.
Speed matters more than most teams admit. A transparent scoring handoff that takes minutes beats a process-heavy one that takes days, even if the slower version is marginally more accurate. Start dashboard training with three metrics: score-band conversion rate, average response time to MQLs, and weekly re-score volume. Rivetline’s own analytics practice notes cover more on wiring predictive signals and intent data into dashboards teams actually check.
Ethical Considerations and Data Privacy in Lead Scoring
Scoring runs on personal and firmographic data, which means privacy compliance isn’t optional paperwork, it’s part of the model design. Under frameworks like GDPR and CCPA, tracking behavioral signals such as page visits and content downloads requires a lawful basis for processing, and prospects generally need visibility into the data you’re collecting and why.
Third-party intent data raises a sharper question: where did that data come from, and did the individuals involved consent to that level of tracking? Vet your intent data providers on this point before layering their signals into your model, not after a prospect asks.
There’s also an internal ethics issue that gets less attention: scoring models can quietly encode bias. If your historical closed-won data skews toward a narrow set of company types or titles because of who your sales team happened to prioritize in the past, a predictive model trained on that data will replicate and amplify the same bias. That’s one more reason to validate model outputs against real outcomes regularly, not just trust the math because it came from a sophisticated-looking algorithm. Document what data feeds your model, who has access to score rationale, and how long you retain behavioral tracking data. Treat that documentation as part of the build, not an afterthought bolted on before an audit.
What Teams Get Wrong About Lead Scoring
Most teams don’t fail at lead scoring because the concept is hard. They fail because someone got excited about machine learning before they had the closed-deal data to feed one, spent months building a predictive model, and shipped something no rep trusted or used.
Start with rules. Measure honestly. Scale to predictive only when your data volume actually earns it. If you do one thing this week, pull your closed-won records and calculate that average score. Everything else follows from that number.
— Chris Breikss
How Rivetline Handles Lead Scoring Implementation
Building a scoring model in a spreadsheet is one thing. Getting it live in your CRM, wired to real dashboards, and actually trusted by your sales team is where most DIY attempts stall out. One can connect Google Business Profile and GA4 data into live Looker Studio dashboards tied directly into CRM routing, so the score rationale reps see is pulled from real activity, not a static PDF someone updates once a quarter. That’s the practical alternative to building this alone with a marketing ops team stretched too thin to maintain it. For teams serious about aligning fit, engagement, and intent data into something sales will actually use, talk to Rivetline about implementation and see what a working model looks like inside your own CRM within weeks, not another failed quarter-long project.
Sources
- The relevance of lead prioritization: a B2B lead scoring model based on machine learning
- What Is Lead Scoring? A Complete Guide
- How to Score and Prioritize B2B Accounts and Leads | Bombora
- 2026 B2B Lead Prioritization Playbook: Scoring, Automation & ROI
FAQ
What is a good B2B lead conversion rate?
Conversion rates vary widely by industry and deal size, but the more useful benchmark is conversion by score band: a properly calibrated “hot” band should convert meaningfully better than your “warm” band. If it doesn’t, your scoring weights need adjustment, not your sales team.
What is the rule of 7 in B2B?
The rule of multiple meaningful touches is a marketing principle suggesting a prospect typically needs repeated exposures to a brand before they’re ready to buy. In lead scoring terms, it’s a reminder that engagement points should accumulate across multiple interactions, not spike from a single visit.
What is a good cost per lead in B2B?
Cost per lead varies enormously by industry and channel, so there’s no single universal benchmark worth quoting. It’s more useful to track cost per lead alongside conversion rate by score band, since a cheap lead that never converts is more expensive than an costly one that closes.
How is lead score calculated?
A lead score is typically calculated by adding weighted points across two categories: fit signals like company size, industry, and job title, and engagement signals like pricing page visits, demo requests, and content downloads. Most teams cap each category and calibrate the total against the average score of their own closed-won deals.